


Abstract
The micro-structured double-layer target is an efficient method to improve proton quality. However, the laser absorption efficiency is low due to strong reflection at the front surface of such targets. Moreover, the proton charge is limited by the driving laser radius. To overcome these shortcomings, a specific double-layer (SDL) target with a vacuum gap in the center of the heavy ion layer is proposed in this paper. In this specified target, the laser reflection effect is significantly weakened and the absorption and penetration efficiencies are greatly enhanced. The high-energy electrons from Breakout afterburner regime efficiently transfer their energy to the protons. Both the energy of the spectral peaks and maximum proton energy are greatly increased. The periodic structure of the longitudinal electric field makes the force applied on the protons becomes homogeneous in time average and therefore reduce the energy spread. In these SDL targets, the proton layer radius and the accelerated proton charge are not limited by the laser radius. With a larger-radius proton layer, the protons can be accelerated to high energy with small energy spread. When the proton layer radius is reduced to the laser radius, the SDL target is still an effective structure to improve the proton quality. The mechanism is proved by a series of particle-in-cell simulations.
Export citation and abstract BibTeX RIS

Original content from this work may be used under the terms of the Creative Commons Attribution 3.0 licence. Any further distribution of this work must maintain attribution to the author(s) and the title of the work, journal citation and DOI.
1. Introduction
In recent years, ion acceleration by ultrashort (∼10−15 s) ultraintense (above 1021 W cm−2) lasers has become an active area of experimental and theoretical research [1, 2]. Laser driven fast ions are expected to be useful in many fields such as high energy density physics diagnostics [3, 4], materials science [5], ion-beam tumor therapy [6], fast ignition of thermonuclear targets [7, 8], conversion of radioactive wastes [9], high-energy physics [10], laboratory astrophysics [11], proton imaging of ultrafast processes in laser plasmas [12] and laser-driven heavy ion collider [13, 14].
Usually, these ions are produced by ultrashort untraintense laser irradiating solid targets. Several regimes for achieving the energetic proton bunches have been proposed and realized in experiments, including the target normal sheath acceleration (TNSA) [15–17], collisionless electrostatic shock acceleration [18–20], breakout afterburner (BOA) acceleration [21–23], radiation pressure acceleration (RPA) [24–26]. In the past decade, most of the work on ion acceleration was based on the TNSA regime. The ions are accelerated by the space-charge field generated when the hot electrons (with energy from keV to MeV) penetrate through the rear surface of the target. The rear surface exposed to this strong field will ionize and ions are accelerated in the forward direction. Protons are preferentially accelerated over heavier ions due to their high charge to mass. The typical spatial extension of the sheath is estimated as the Debye length of hot electrons and the field decays over a few microns. Therefore, the ions are accelerated in a short distance with a broad (quasi-thermal) energy spectrum and a sharp cut-off energy. To overcome the problem of large energy spread, several methods, including tailoring the target shape, changing the ion species, multi stage acceleration, have been presented. One of the ways for improving the proton quality is the micro-structured double-layer (DL) target scheme which was proposed by Esirkepov et al [27] and has been widely investigated in both theory and experiment [28–38].
In the traditional DL targets, a light ion layer is attached at the rear of the heavy ion layer. The light-ion coating layer experiences approximately a constant sheath electric field during the laser-plasma interaction, which guarantees that all the light-ions are accelerated to essentially the same energy by the homogeneous field. But there are two main problems. First, the majority of the laser is reflected due to the high density of the heavy-ion layer. So the laser energy conversion becomes inefficient. On the other hand, to ensure all protons to experience the same acceleration field, the transverse size of the light-ion coating layer should be smaller than the laser radius. At the same time, the light ion layer density should be low to weaken the Coulomb explosion effect. So the second issue of the DL target is that the total charge of the accelerated light-ion is limited due to lower density and smaller volume. In this paper, we demonstrate a specific double layer (SDL) target with a preformed small size vacuum gap in the center of the heavy ion layer. The SDL target employed here has also been used in other experimental and theoretical works [39–41]. Sometimes it is called nanostructured foil or micro-tube plasma depending on different scale. The laser absorption rate is increased due to the laser penetration through the vacuum gap and the corresponding BOA regime inducing in the proton layer. It improves the obtained proton beam quality and increases the beam energy despite of the transverse size of the target. Therefore, the charge quantity of the accelerated protons is not limited by the laser radius. The SDL target works even better when the proton layer size is decreased to the laser radius.
2. Simulation setup
To compare the effects brought by SDL target, we set up two simulation groups. The simulations were performed with the electromagnetic relativistic particle-in-cell (PIC) code 'ZOHAR' [42]. The simulation box size is 30λ × 30λ with 3000 × 3000 cells. Free boundary condition is employed for both particles and fields. The target geometries for the general double layer (GDL) target (Case 1) and the SDL target (Case 2) are presented in figures 1(a) and (b) where ni is the carbon ion density and np is the proton density. The targets are the same for the two cases except for the vacuum gap in SDL target. The fully ionized carbon layer locates between  with a uniform density of ni = 50nc and the proton layer lies in
  with np = 0.1nc . The transverse sizes of the targets are 10λ. There is a vacuum gap in the SDL target for
  The Gaussian laser pulse, focused on the front surface of the carbon layer, is linearly polarized in the y-direction with the beam waist
  the pulse duration
  and the peak intensity
  The laser wavelength is
  In all the following simulations, the laser and the target parameters are the same except when stated otherwise.
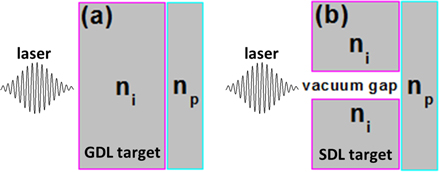
Figure 1. The geometries of the GDL target and the SDL target are shown in (a) and (b). The carbon ion layer and proton layer densities are  and
and  for both cases. The vacuum gap is located in the center and its diameter is
  The laser pulse is incident from left side.
Download figure:
Standard image High-resolution image3. Simulation results and discussions
Most of the incident laser energy is reflected by the high-density heavy ion layer in Case 1 as shown in figure 2(a). A portion of the laser energy is absorbed by the particles, while a weak transmitted laser reaches the vacuum region on the target rear side. For Case 2, due to the proton layer being underdense and therefore transparent to the laser light, a considerable part of the laser can penetrate the target as depicted in figure 2(b). It shows a diffraction structure in the rear side of the target, which is also obtained and mentioned in [43]. In order to analyze the laser reflection, absorption and penetration rates, we plot the time evolution of the laser energy for  for both cases in figure 2(c). The first peak is the total laser energy before laser-plasma interaction while the second peak is the reflected laser energy. In Case 1, 89% of the incident laser energy is reflected, while the reflection ratio is reduced to 56% in Case 2. We also demonstrate the time evolution of the transmitted laser energy in figure 2(d). The laser penetration ratios are 0.5% and 14.5% for the two cases. Therefore, the laser absorption rates are 10.5% and 29.5% for Case 1 and Case 2. Moreover, we plot the time evolution of the total electron energy for both cases in figure 3(a). Only about 2.5% of the laser energy is converted into the hot electrons in Case 1, but it becomes 7% in Case 2. It is predictable that the accelerated protons have more energy in Case 2 than that in Case 1 (as seen in figure 3(b)), due to the fact that the protons obtain energy from the hot electrons.
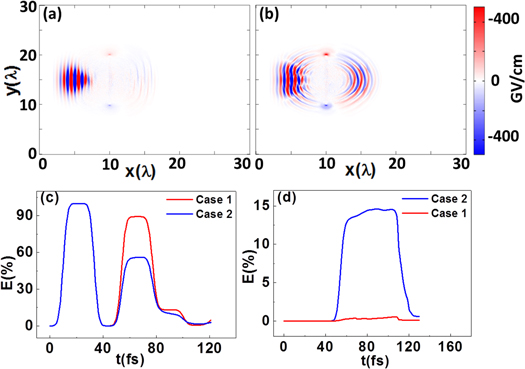
Figure 2. The laser transverse electric field distributions when the laser just penetrates the target for Case 1 and Case 2 are plotted in (a) and (b). (c) Shows the temporal evolution of the laser energy for  for both cases. The time evolution of the laser energy in vacuum part of the target rear side for both cases is plotted in (d).
Download figure:
Standard image High-resolution image
Figure 3. The time evolution of the electron energy in both cases is plotted in (a). (b) Depicts the energy evolution with time for the protons.
Download figure:
Standard image High-resolution imageThe transverse and the longitudinal electric field distributions during laser-target interaction for Case 2 are plotted in figure 4. The laser is compressed to a very small radius and propagates through the vacuum gap. The transverse electric field periodically distributes in the vacuum gap with high intensity. The interface electrons are periodically pulled out the target and transversely enter into the vacuum gap. At the same time, the laser provides a longitudinal ponderomotive force in the vacuum gap. The electrons transversely entering into the vacuum gap can ride on the laser longitudinal field and be accelerated.

Figure 4. The transverse and longitudinal electric field distributions as the laser is penetrating the SDL target at 39, 41, 43 and 45 fs. The upper-row figures show the transverse field distributions while the lower-row pictures show the longitudinal electric field distributions.
Download figure:
Standard image High-resolution imageThe above analysis about interface electrons between the vacuum gap gaining energy from the laser field can be proved by the electron density distribution evolution. We plot the electron density profiles for both cases in figure 5. The top panel is from Case 1 while the bottom panel is corresponding to Case 2. In Case 2, the electrons are pulled out of the target by the laser transverse and longitudinal electric fields. Then they transversely expand with the laser in the vacuum region on the target rear side. The charge of the electrons pulled out of the target by the laser is large because the penetrated laser is strong enough. In this case, the target is transparent to the laser pulse and the BOA regime dominates the main acceleration, in which the proton energy is increased due to enhanced and volumetric heating of electrons. It should be noted that the hot electrons pulled out from the vacuum gap also contribute a large fraction to the overall leading electrons driving the acceleration. Therefore the acceleration effect in the SDL target case is better than a single layer BOA case. However, in Case 1, TNSA is the main acceleration regime since the heated electrons do not have enough energy to escape away from the target as seen in figure 5(c). In fact, many returned hot electrons are neutralized by the heavy ion layer.

Figure 5. The electron density profiles at 44, 54 and 72 fs are shown. The upper-row and lower-row pictures show the density profiles for Case 1 and Case 2, respectively.
Download figure:
Standard image High-resolution imageIn the double layer target, the acceleration electric field is contributed by both the ions and the leading electrons in the rear side vacuum region. The longitudinal electric field is

where  is the charge density, Id is the disk thickness,
  is the vacuum permittivity, and R is the charged disk radius. The first term of equation (1) is the x component of the electric field generated by a thin disk with positive charge. The second item, Eele, is contributed by the leading electrons which can be estimated as: eEele ∼ Th/Ls, where Th and Ls is the typical temperature and extension length of the hot electrons. The typical length Ls can be roughly regarded as the same with Debye length of the hot electrons, Ls ∼
  Here, nh is the initial density of the hot electrons. In the solid target case, it should satisfy the energy flux condition and can be estimated as
  ηh is the fractional absorption and vh is the velocity of the hot electrons. The typical temperature is of the order of the cycle-averaged oscillation energy in the laser field, which is Th ∼
  In our cases, the magnitude of the electric field generated by the ions (the first term of equation (1)) is of the order of ∼109 V m−1. However, the electric field produced by the leading electrons is of the order of ∼1013 V m−1, which is much stronger than the previous term and becomes the dominant contribution. Here we note that the strength of the electric field is positively related to the density and temperature of the hot electrons and therefore to the laser energy absorption. It is clear that the acceleration field in Case 2 will be larger than that in Case 1 due to the higher absorption rate.
The profile of the leading electrons greatly affects and modifies the electrostatic field structure. Due to the periodicity of the transverse laser electric field, the vacuum gap surface electrons are pulled out layer by layer in Case 2. The accelerated electron layer center transversely oscillates around the laser axis. It makes the peak of the charge separation field on the rear side also oscillate with the periodic electron distribution as shown in figure 6 where the longitudinal electric fields along  for Case 1 and 2 are plotted in the top and bottom panel. In Case 1 the electric field for TNSA is centrally peaked because the Gaussian transverse distribution of the laser electric field is mapped onto the hot electron distribution at the front surface and this distribution is maintained as the hot electrons transport from front to rear surface. The transverse location of the electric field peak hardly moves. So the acceleration fields experienced by protons depend on their locations which produce a relatively large energy spread. It should be noted that the broadband energy spread is also due to the sheath field decaying over time as the protons expand and carry energy away from the hot electrons, therefore degrading the acceleration fields. However, the electric field peak moves up and down periodically in Case 2 as described above. Therefore the longitudinal field applied to the protons becomes homogeneous in time average as
  The homogeneous structure of the field significantly reduces the energy spread of the accelerated protons. Furthermore, the electric field peak reaches 1014 V m−1 in Case 2 which is two times larger than that in Case 1. The electric field produced by the hot electrons from TNSA regime is limited within several Debye lengths and protons cannot be long-range accelerated. In this case, the laser conversion efficiency to protons and the proton energy will be smaller. However, in Case 2, the electric field produced by the accelerated electrons from BOA scheme can spread over a large volume. These electrons can efficiently transform their energy to protons in a long acceleration distance.
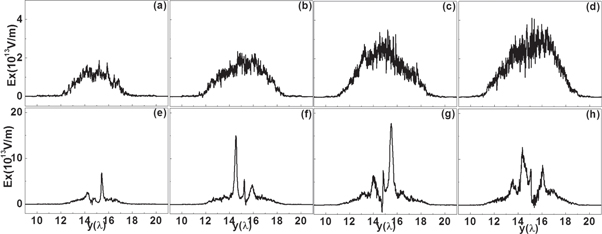
Figure 6. The longitudinal electric field distributions for  are shown at 39, 41, 43 and 45 fs for both cases. The top panel shows the longitudinal electric field profiles in Case 1. The bottom panel for the electric field distributions in Case 2.
Download figure:
Standard image High-resolution imageFrom the above discussion, it is expected that the accelerated protons in Case 2 should have higher energy and smaller energy spread compared with the bunch obtained in Case 1. In figure 7, we plot the proton density distributions at three moments for both cases. The top-row figures show the protons in Case 1 while the bottom ones depict the proton density in Case 2. It is clear that the protons in Case 2 move forward faster than the protons from Case 1, which indicates a stronger acceleration effect. We also notice that there is an extra proton bunch shown in the SDL case, which has a different shape surrounding the head of the arc proton beam. The main proton beams which have the similar arc shape in both Case 1 and Case 2 can be regarded as accelerated by the same TNSA mechanism but with different strength due to the different laser conversion efficiency. The extra bunch in SDL target represents the protons accelerated not only by the TNSA effect but also by the extra hot electrons generated in the vacuum gap. It shows a good quality in the following analysis.

Figure 7. The proton density distributions at 54, 72 and 170 fs are revealed in the upper-row figures for Case 1 and in the lower-row pictures for Case 2.
Download figure:
Standard image High-resolution imageTo reveal the proton beam quality and prove the above predictions, we plot the energy spectra of all the accelerated protons for both cases in figure 8. The energy spectrum of Case 1 has two peaks as shown in figure 8(a). The similar two peaks in energy spectrum are also obtained in other works [16, 44]. One has the peak energy of 9 MeV with the energy spread of 13% containing the charge of 0.001 nC μm−1. The corresponding values for the second peak are 26 MeV, 7%, 0.0002 nC μm−1, respectively. In Case 2, the similar spectrum profile with two peaks is shown. The peak energy, relative energy spread and the proton number in FWHM of the peaks are 37 MeV, 4%, 0.000 82 nC μm−1 and 56 MeV, 4%, 0.0002 nC μm−1 for the two peaks. We focus on the main peak which contains more particles (the peak with lower energy) in the above cases. Both the peak energy and the energy spread are improved by the SDL target. The proton number in the FWHM of the main peak is slightly decreased. The cut-off energy is enhanced from 27 to 69 MeV by using SDL target. Also, it is clear that the high-energy proton number is much larger in SDL target case than that in GDL target case by comparing the figures 8(a) and (b). Almost all protons have energy above 35 MeV in SDL target case, however, the energy of all protons are below 30 MeV in GDL target case. The peak energy increase is attributed to the higher laser energy conversion efficiency to the accelerated electrons in Case 2. The energy spread reduction is due to the time-averaged homogeneous electric field brought by the periodic electron distribution. The energy spectrum for the extra proton bunch is plotted in figure 8(c). The quality of the extra bunch is quite good. Its peak energy and energy spread are 57 MeV and 1.5%. So the proton quality can be further improved by the SDL target if the extra proton beam can be separated and extracted from the other beam.
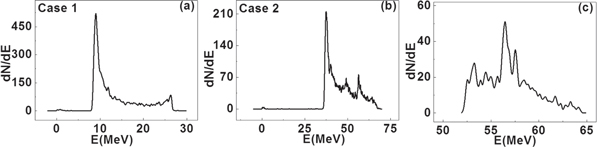
Figure 8. (a) and (b) are the proton energy spectra for Case 1 and Case 2, respectively. The energy spectrum of the extra proton beam in Case 2 is plotted in (c).
Download figure:
Standard image High-resolution imageFor the traditional DL target, the heavy ion foil has an optimal thickness of the order of  [28, 45]. Here we perform another two simulation groups with the heavy ion layer thickness of l = 0.07λ and 0.05λ to test the validity of the SDL target for the different thickness. For the GDL target, the simulations are marked as Case 3 and Case 5 for 0.07λ and 0.05λ, respectively. Case 4 and Case 6 represent the corresponding thickness for the SDL target. The energy spectra of the accelerated proton beams are plotted in figures 9(a) and (b) for the above cases. The peak energy and energy spread (for the main peak) in Case 3 and Case 5 are 10 MeV, 16 MeV, 9% and 17%, respectively. However, the corresponding quantities in Case 4 and Case 6 are 37 MeV, 35 MeV, 6%, and 5%. Compared with all the above cases, one can find that the SDL target provides a peak energy around 35–37 MeV and a small energy spread within 10%. The improvement of the energy and beam quality brought by SDL target is clear.
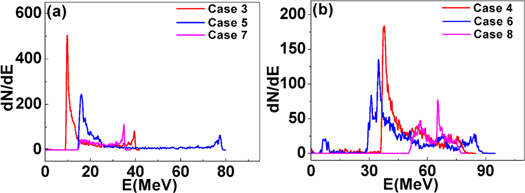
Figure 9. The energy spectra of the protons for Case 3, 5, 7 and Case 4, 6, 8 are shown in (a) and (b).
Download figure:
Standard image High-resolution imageGenerally, in DL target ion acceleration cases the target transverse size especially the proton layer radius (the transverse size) should be smaller than the laser radius to ensure the accelerated protons to feel the uniform acceleration field. However, with the SDL target, the target transverse size is not limited by the laser radius. Here we reduce the transverse size of the targets from 10λ to 2λ, i.e. the laser radius, and run the simulations marked as Case 7 and Case 8 for the GDL and SDL targets. The obtained proton beam energy spectra are plotted in figures 9(a) and (b) (pink curves). In Case 7, the low-energy peak disappears and also the cut-off energy is lower than the previous cases for the GDL target. In Case 8, the maximum energy is about 79 MeV and the energy spread of the main peak is about 1.5%. The number of the accelerated protons in the main peak of Case 8 reaches 0.000 16 nC μm−1, which is as high as the previous cases of the SDL targets. The obtained proton bunch does not decrease with the transverse size of the target. So we find that the SDL target works also better provided that the proton layer radius is as small as the laser radius.
4. 3D simulation results
To prove the validity of the SDL target, we redo Case 1 and Case 2 with 3D PIC simulations. To save the simulation time, we reduce the size of the targets to 7λ × 5λ × 5λ and move the target left boundary to x = 2λ. The targets for both GDL and SDL keep the same thickness as Case 1 and Case 2. But the transverse sizes are reduced to 4λ. The vacuum gap in the SDL target is located at  The 3D simulations have the same resolution as the 2D cases with the mesh size
  To see the acceleration effects clearly in a relative short distance, circular polarized laser pulses are employed here with the same peak intensity
  .
.
The proton density distributions for the two cases are plotted in figures 10(a) and (b). It is consistent with the 2D density distributions shown in figure 7. We also plot the energy spectrum in the 3D cases in figure 10(c). Both cases have two energy peaks as the results for the 2D cases. The cut-off energies in the 3D cases are slightly lower than in the 2D cases. But the main peak for the SDL target is almost same in the 2D and 3D cases. The energy spectra in the 3D simulations also support the conclusion that the SDL target could improve the accelerated proton energy and reduce the energy spread. One may find the difference between the 2D and 3D energy spectra is the large number of low energy particles. It is due to the polarization of the laser pulse. In the 2D case, the linearly polarized laser covers the whole target region and pushes almost all the protons. But in the 3D cases, there will be a lot of background protons which are not kicked by the laser pulse and form the low energy part in the spectrum. We also plot a scatter image of the proton energy for the SDL target case in figure 10(d). The energetic protons gather at the head and it shows a relation between the energy and the propagation distance. It is also clear that the accelerated beam is well collimated in the SDL target. The results also prove that the SDL target is effective despite of the laser polarization. The details and the mechanisms of the irrelevance to the laser polarization will be focused in the future work.

Figure 10. The proton density distribution for GDL and SDL targets in the 3D simulations are shown in (a) and (b). The color scales from 3 × 1024 m−3 (0.002nc) to 1026 m−3 (0.1nc). The energy spectra for GDL and SDL cases are compared in (c). The energy scattering image for the SDL target in 3D case is plotted in (d).
Download figure:
Standard image High-resolution image
5. Conclusion
In this paper, we propose an improved double layer target with a vacuum gap in the center of the heavy ion layer to enhance the laser conversion efficiency and the quality of the accelerated proton beam. The effects brought by the SDL target are investigated in detail by a series of PIC simulations. The laser reflection is greatly reduced while the laser absorption is enhanced by the SDL target due to the laser penetration through the vacuum gap and the corresponding BOA regime inducing in the transparent proton layer. The SDL target increases the number and the energy of the accelerated protons. By using the SDL target, it is no longer necessary to limit the proton layer radius to be smaller than the laser radius. The double layer target structure occurs naturally when the back side of solid target samples are contaminated by water vapor and hydrocarbons [46]. In addition, such a target in experiment can be produced using controlled hydrogen doping of a higher-Z material by doping technique [33].
Acknowledgments
This work is supported partially by Natural Science Foundation of China under Contract No. 10605010 and Shanghai Leading Academic Discipline Project B107, and partially by the JSPS-CAS Core-University Program on Plasma and Nuclear Fusion and the Utsunomiya University Center for Optical Research & Education. This work was also supported by the project ELI: Extreme Light Infrastructure (CZ.02.1.01/0.0/0.0/15_008/0000162) from European Regional Development. Computational resources were partially provided by ECLIPSE cluster of ELI-Beamlines. We also have support from China Scholarship Council. Q Yu also expresses appreciation to Dr S Weber at ELI-Beamlines.